G-Suite
Synology NAS
Symantec
FortiGate
FortiAnalyzer
ติดต่อเรา
Lorem ipsum dolor sit amet, consectetur
adipiscing elit. Nullam fermentum fermentum
tortor nec dignissim. Nunc sit amet augue dui.
Integer vestibulum vel eros a sollicitudin. Nunc
in rutrum mi. Aliquam mollis ac urna eget
molestie. Aenean vel maximus nisi. Nullam
ligula nunc, iaculis eu leo accumsan,
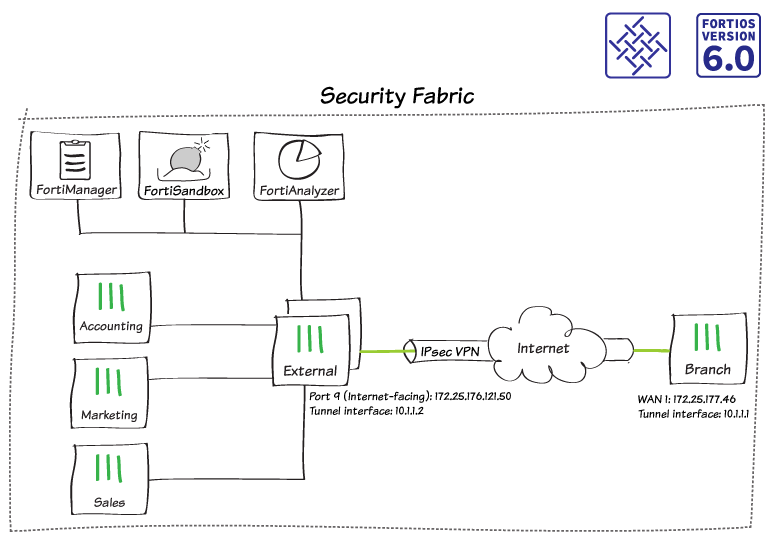
ในกรณีนี้คุณเพิ่ม Traffic ของ FortiTelemetry ให้กับ IPsec VPN site-to-site tunnel ที่มีอยู่เดิมระหว่างอุปกรณ์ FortiGate สองอุปกรณ์ เพื่อเพิ่ม FortiGate จากระยะไกล (Remote FortiGate) ไปยัง Security Fabric และคุณยังอนุญาตให้ FortiGate จากระยะไกลเข้าถึง FortiAnalyzer สำหรับการบันทึก (Logging)
หากคุณยังไม่ได้สร้าง VPN ของแต่ละ Site ให้ดูที่คู่มือ “Site-to-site IPsec VPN กับ อุปกรณ์ FortiGate สองเครื่อง”
ในตัวอย่างนี้, HA cluster ที่เรียกว่า Edge คือ Root FortiGate ใน Security Fabric และ FortiGate ที่เรียกว่า Branch คือ FortiGate ระยะไกล (Remote FortiGate)
1. กำหนดค่า Tunnel interfaces
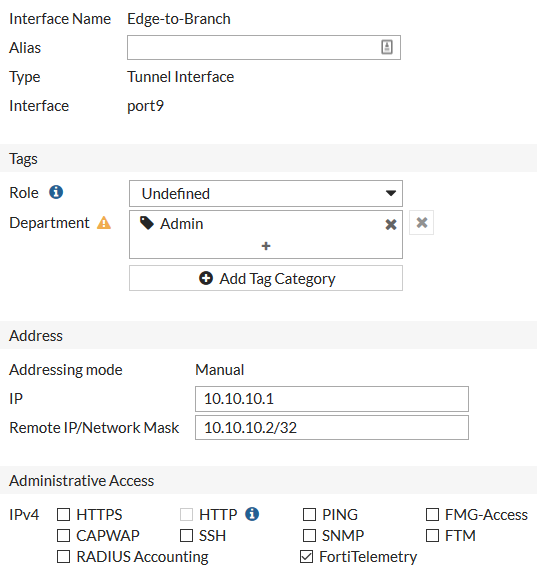
1.1 => ในการกำหนดค่า Edge เพื่อฟัง Traffic ของ FortiTelemetry บน VPN ให้เชื่อมต่อกับ Edge แล้วไปที่ “Network > Interfaces” และแก้ไข Tunnel interface
=> ตั้งค่า “IP” เป็น Local IP address สำหรับ Interface นี้ (10.10.10.1) และ "Remote IP/Network mask" เป็น IP address สำหรับ Branch tunnel interface (10.10.10.2/32)
=> ภายใต้ “Administrative Access”, เปิดใช้งาน “FortiTelemetry”
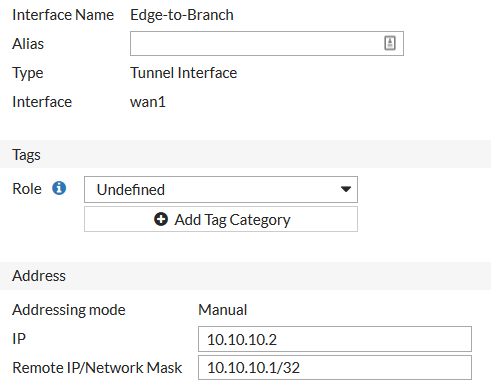
1.2 => เชื่อมต่อกับ Branch, ไปที่ “Network > Interfaces” และแก้ไข Tunnel interface
=> ตั้งค่า “IP” เป็น Local IP address สำหรับ Interface นี้ (10.10.10.2) และ “Remote IP/Network mask” เป็น IP Address สำหรับ Edge tunnel interface (10.10.10.1/32)
2. เพิ่ม Tunnel interfaces ลงใน VPN
2.1 => ในการสร้าง Address สำหรับ Edge tunnel interface ให้เชื่อมต่อกับ Edge, ไปที่ “Policy & Objects > Addresses” และสร้าง Address ใหม่
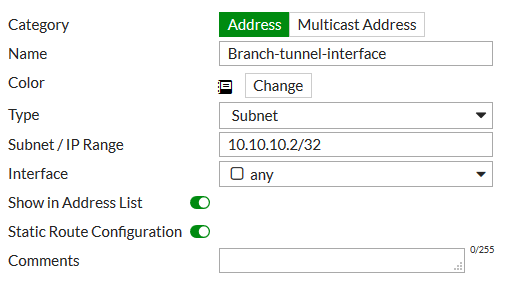
=> กำหนด “Category” เป็น Address และตั้งค่า “Subnet/IP Range” เป็น IP address สำหรับ Edge tunnel interface (10.10.10.1/32)
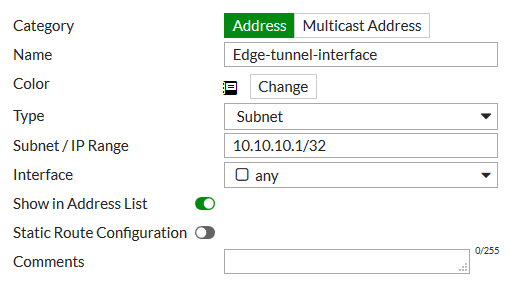
2.2 => สร้าง Address ที่สอง สำหรับ Branch tunnel interface โดยสำหรับ Address นี้ ให้เปิดใช้งาน “Static Route Configuration”
2.3 => ในการอนุญาต VPN traffic ระหว่าง Edge tunnel interface และ the Branch tunnel interface ให้ไปที่ “VPN > IPsec Tunnels” และแก้ไข VPN tunnel เลือก “Convert To Custom Tunnel”
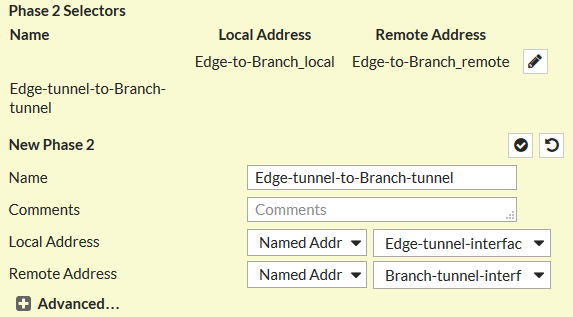
=> ภายใต้ “Phase 2 Selectors”, สร้าง Phase 2 ใหม่ ตั้งค่า “Local Address” เพื่อใช้ Named Address และเลือก Address สำหรับ Edge tunnel interface ตั้งค่า “Remote Address” เพื่อใช้ Named Address และเลือก Address สำหรับ Branch tunnel interface
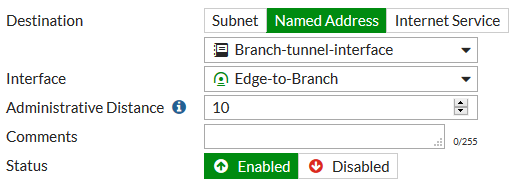
2.4 => ในการ Route traffic ไปยัง Branch tunnel interface ให้ไปที่ “Network > Static Routes” และสร้าง Route ใหม่
=> ตั้งค่า “Destination” เป็น Named Address และเลือก Address สำหรับ Branch tunnel interface ตั้งค่า “Device” เป็น Tunnel interface
2.5 => ในการอนุญาต Traffic ระหว่าง Tunnel interfaces, ให้ไปที่ “Policy & Objects > IPv4 Policy” และแก้ไข Policy ที่อนุญาตการรับส่งข้อมูล VPN ภายใน (Local VPN traffic)
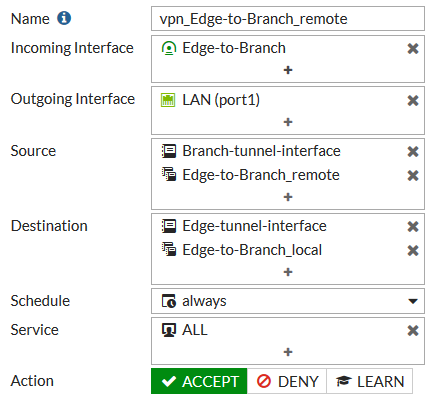
=> ตั้งค่า “Source” ให้รวม Edge tunnel interface และ “Destination” ให้รวม Branch tunnel interface

2.6 => แก้ไข Policy ที่อนุญาต Remote VPN traffic ที่จะรวม Tunnel interfaces
2.7 => บน Branch, ทำซ้ำขั้นตอนนี้เพื่อรวมสิ่งต่อไปนี้:
=> Addresses สำหรับ Tunnel interfaces ทั้งสอง (เปิดใช้งาน Static Route Configuration สำหรับ Edge tunnel interface address)
=> Phase 2 ที่อนุญาต Traffic ระหว่าง Branch tunnel interface และ Edge tunnel interface
=> Static route ไปยัง Edge tunnel interface
=> นโยบายที่แก้ไข (Edited policies) ที่อนุญาต Traffic ในการไหล (Flow) ระหว่าง Tunnel interfaces
2.8 => ในการอนุญาตให้ Phase 2 ใหม่ มีผลบังคับใช้ ให้ไปที่ Monitor > IPsec Monitor และรีสตาร์ท VPN tunnel
3. ให้สิทธิ์ (Authorizing) Branch สำหรับ Security Fabric
3.1 => คุณสามารถให้สิทธิ์ FortiGate, FortiAP หรือ FortiSwitch ให้เข้าร่วม Security Fabric โดยใช้หมายเลข Serial ของอุปกรณ์แทนที่จะแชร์รหัสผ่านสำหรับ Security Fabric (ตัวเลือก Group password ยังไม่พร้อมใช้งานใน FortiOS 6.0.3 และใหม่กว่า)
=> ในการอนุญาตสิทธิ์ให้ Branch นั้น ให้เชื่อมต่อกับ Edge, แล้วป้อนคำสั่ง CLI ต่อไปนี้:
config system csf
config trusted-list
edit < serial_number >
end
end
3.2 => ในการเพิ่ม Branch ไปยัง Security Fabric ให้เชื่อมต่อกับ Branch, และไปที่ “Security Fabric > Settings”
=> เปิดใช้งาน “FortiGate Telemetry”, ตั้ง Group name, เว้นว่าง Group password ไว้ (ตัวเลือก Group password ไม่พร้อมใช้งานใน FortiOS 6.0.3 และใหม่กว่า) เปิดใช้งาน “Connect to upstream FortiGate”, ตั้งค่า “FortiGate IP” เป็น IP address ของ Edge tunnel interface

3.3 => ในการตรวจสอบว่า Branch เป็นส่วนหนึ่งของโครงสร้างความปลอดภัย (Security Fabric) ให้เชื่อมต่อกับ Edge, แล้วไปที่ “Security Fabric > Settings”, Branch จะปรากฏใน Topology

4. อนุญาตให้ Branch เข้าถึง FortiAnalyzer
4.1 => ในการสร้าง Address สำหรับ FortiAnalyzer, ให้เชื่อมต่อกับ Branch, แล้วไปที่ “Policy & Objects > Addresses” และสร้าง Address ใหม่ เปิดใช้งาน “Static Route Configuration”

4.2 => ในการอนุญาต VPN traffic ระหว่าง FortiAnalyzer และ Branch tunnel interface, ให้ไปที่ “VPN > IPsec Tunnels” และสร้าง Phase 2 ใหม่

4.3 => ในการ Route traffic ไปยัง FortiAnalyzer, ให้ไปที่ “Network > Static Routes” และสร้าง Route ใหม่

4.4 => บน Edge, ให้ทำซ้ำขั้นตอนนี้เพื่อสร้าง Address สำหรับ FortiAnalyzer และ Phase 2 ใหม่ที่อนุญาตให้มีการรับส่งข้อมูลระหว่าง FortiAnalyzer และ Branch tunnel interface โดย Edge ไม่จำเป็นต้องใช้ Static route ใหม่
4.5 => ในการอนุญาตการรับส่งข้อมูลระหว่าง Branch และ FortiAnalyzer ให้ไปที่ “Policy & Objects > IPv4 Policy” และสร้าง Policy ใหม่
=> ตั้งค่า “Incoming Interface” เป็น VPN interface และตั้งค่า “Outgoing Interface” เป็น Interface ที่เชื่อมต่อกับ FortiAnalyzer (ในตัวอย่างเป็น Port 16), ตั้งค่า “Source” เป็น Branch tunnel interface และตั้งค่า “Destination” เป็น FortiAnalyzer
=> เปิดใช้งาน “NAT” สำหรับ Policy นี้

4.6 => ในการให้สิทธิ์ Branch FortiGate บน FortiAnalyzer, ให้เชื่อมต่อกับ FortiAnalyzer แล้วไปที่ “Device Manager > Unregistered”
=> เลือก “Branch” จากนั้นเลือก +Add เพื่อ Register Branch

4.7 => ตอนนี้ Branch จะปรากฏเป็น “Registered”

5. ผลลัพธ์
=> หากต้องการดูว่า Branch เป็นส่วนหนึ่งของ Security Fabric topology, ให้เชื่อมต่อกับ Edge และไปที่ “Security Fabric > Logical Topology”, Branch จะแสดงว่าเป็นส่วนหนึ่งของ Security Fabric ซึ่งเชื่อมต่อผ่าน IPsec VPN tunnel

6. แยกการซิงโครไนซ์ Branch จาก FortiAnalyzer, FortiSandbox และ FortiManager (ทางเลือก)
6.1 => หากคุณไม่ต้องการให้ Branch ใช้การตั้งค่าที่ Edge ผลักดันให้กับ FortiAnalyzer, FortiSandbox และ FortiManager โดยอัตโนมัติ ให้ใช้คำสั่ง CLI ต่อไปนี้เพื่อกำหนดการตั้งค่าเหล่านี้:
config system csf
set configuration-sync local
end
=> ไปที่ “Security Fabric > Settings” ตอนนี้คุณสามารถกำหนดการตั้งค่าสำหรับ FortiAnalyzer logging, Central Management และ Sandbox Inspection คุณยังสามารถเลือกที่จะใช้การบันทึกในระบบ (Local logging) แทนที่จะส่งบันทึกไปยัง FortiAnalyzer
=> ตัวเลือกนี้มีให้สำหรับอุปกรณ์ FortiGate ทั้งหมดใน Security Fabric ยกเว้นสำหรับ Root FortiGate